Blog Archive

Wednesday, September 30, 2009

The Greenland ice sheet is shrinking

The Greenland ice sheet is shrinking


Satellite readings show Greenland is losing large quantities of ice. The enormous ice cap constituting the inland ice is melting at an ever-increasing rate, and there is every indication that the inland ice is contributing to the rise in sea level of the oceans.

An enormous net loss

Scientists are monitoring developments using satellites, light aircraft and observations on the ice, and most agree that global warming is the cause of this melting.

At the heart of the problem is the fact that ice formation occurring on the inland ice as a result of winter snowfalls cannot compensate for the melting. In other words, there is a net loss of ice. Calculations by a Dano–US team of scientists show an annual volume loss of about 257 km³.

The average net loss of ice in 2080 will have reached 465 km³ – a loss of ice 80% greater than today, research scientists of the International Arctic Research Center, Fairbanks, Alaska, state to Ritzau.

The melting is accelerating

A specific example of the situation is that twice as much ice melted in 2007 as was the case just three years earlier. In general, the region where there is increased melting has grown considerably in recent years. The melting has mainly occurred in the southern part of the inland ice and at the edges of the ice up to 3 km in height.

Glaciers are calving sooner

Readings show that the periphery of the inland ice is accelerating outwards. Therefore, the glaciers are calving sooner and more violently than before, and enormous icebergs are forming.

At the same time, the fronts of the largest glaciers are receding. This is due to a rise in summer temperatures. Only very little additional heat would be required for the snow covering large areas to disappear. A temperature increase of 1 °C distributed evenly across the large ice cap is enough to melt a vertical metre of ice each year. In other words, this would require one additional metre of ice to form from winter snowfalls in order to prevent the glacier from receding.

Measuring the ice

In the past, it was incredibly expensive and difficult to collect accurate information on the melting of the inland ice. In recent years, however, advanced satellites have made it possible to gather very accurate data, and a GPS network, GNET, positioned along the edge of the inland ice will provide data for use in calculations. GNET, which will be completed in 2010, is being established as a collaborative venture involving research scientists from the US, Luxembourg and Denmark.

GEUS is leading an ongoing monitoring programme (Programme for Monitoring of the Greenland Ice Sheet (PROMICE)that combines readings from GPS stations with data from aircraft and satellites to equip scientists to calculate the combined mass loss of the inland ice on an annual basis.

Meltwater in the sea

The inland ice is releasing increasing amounts of fresh water into the North Atlantic, which has a major impact on global ocean currents. This could have inherent consequences for the global climate, but no one knows exactly how or to what extent.

Professor Dorte Dahl-Jensen of the Niels Bohr Institute at the University of Copenhagen believes sea levels may rise by almost 1 m by the year 2100. The IPCC, the UN Intergovernmental Panel on Climate Change, is of the opinion that the maximum rise in sea level this century will probably be around 59 cm.

In Dorte Dahl-Jensen's opinion, the Panel on Climate Change has underestimated the melting of the inland ice. The Panel has first and foremost calculated the effect of melted sea ice. She expects 30 cm to come from the melting of the ice on Greenland and 30 cm from melting in Antarctica. The rest will come from small glaciers, and as a consequence of the water in the sea expanding as it warms.

Link to article:  http://climategreenland.com/klimaforandringer/indlandsisen_skrumper/&new_language=1

UNEP: Impacts of climate change coming faster and sooner: New science report underlines urgency for governments to seal the deal in Copenhagen

Impacts of climate change coming faster and sooner: New science report underlines urgency for governments to seal the deal in Copenhagen

Washington/Nairobi, 24 September 2009 -The pace and scale of climate change may now be outstripping even the most sobering predictions of the last report of the Intergovernmental Panel of Climate Change (IPCC).


An analysis of the very latest, peer-reviewed science indicates that many predictions at the upper end of the IPCC's forecasts are becoming ever more likely.


Meanwhile, the newly emerging science points to some events thought likely to occur in longer-term time horizons, as already happening or set to happen far sooner than had previously been thought.


Researchers have become increasingly concerned about ocean acidification linked with the absorption of carbon dioxide in seawater and the impact on shellfish and coral reefs.


Water that can corrode a shell-making substance called aragonite is already welling up along the California coast decades earlier than existing models predict.


Losses from glaciers, ice-sheets and the Polar Regions appear to be happening faster than anticipated, with the Greenland ice sheet, for example, recently seeing melting some 60% higher than the previous record of 1998.


Some scientists are now warning that sea levels could rise by up to two metres by 2100 and five to ten times that over following centuries.


There is also growing concern among some scientists that thresholds or tipping points may now be reached in a matter of years or a few decades including dramatic changes to the Indian sub-continent's monsoon, the Sahara and West Africa monsoons, and climate systems affecting a critical ecosystem like the Amazon rainforest.


The report also underlines concern by scientists that the planet is now committed to some damaging and irreversible impacts as a result of the greenhouse gases already in the atmosphere.


Losses of tropical and temperate mountain glaciers affecting perhaps 20-25% of the human population in terms of drinking water, irrigation and hydro-power.


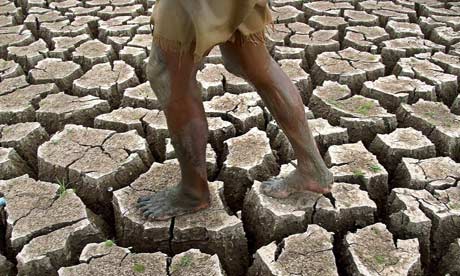
Shifts in the hydrological cycle resulting in the disappearance of regional climates with related losses of ecosystems, species and the spread of drylands northwards and southwards away from the equator.


Recent science suggests that it may still be possible to avoid the most catastrophic impacts of climate change. However, this will only happen if there is immediate, cohesive and decisive action to both cut emissions and assist vulnerable countries adapt.


These are among the findings of a report released today by the United Nations Environment Programme (UNEP) entitled Climate Change Science Compendium 2009.


The report, compiled in association with scientists around the world, comes with less than 80 days to go to the crucial UN climate convention meeting in Copenhagen, Denmark.


In a foreword to the document, the United Nations Secretary-General, Ban Ki-moon, who this week hosted heads of state in New York, writes, "This Climate Change Science Compendium is a wake-up call. The time for hesitation is over."
 

"We need the world to realize, once and for all, that the time to act is now and we must work together to address this monumental challenge. This is the moral challenge of our generation."


The Compendium reviews some 400 major scientific contributions to our understanding of Earth Systems and climate change that have been released through peer-reviewed literature, or from research institutions, over the last three years.


Achim Steiner, UN Under-Secretary General and UNEP Executive Director, said, "The Compendium can never replace the painstaking rigour of an IPCC process -- a shining example of how the United Nations can provide a path to consensus among the sometimes differing views of more than 190 nations."


"However, scientific knowledge on climate change and forecasting of the likely impacts has been advancing rapidly since the landmark 2007 IPCC report," he added.


"Many governments have asked to be kept abreast of the latest findings. I am sure that this report fulfils that request and will inform ministers' decisions when they meet in the Danish capital in only a few weeks time," said Mr. Steiner.


The research findings and observations in the Compendium are divided into five categories: Earth Systems, Ice, Oceans, Ecosystems and Management. Key developments documented since the IPCC Fourth Assessment Report include:


Earth Systems


A new climate modeling system, forecasting average temperatures over a decade by combining natural variation with the impacts of human-induced climate change, projects that at least half of the 10 years following 2009 will exceed the warmest year currently on record. This is despite the fact that natural variation will partially offset the warming "signal" from greenhouse gas emissions.


The growth in carbon dioxide emissions from energy and industry has exceeded even the most fossil-fuel intensive scenario developed by the IPCC at the end of the 1990s. Global emissions were growing by 1.1% each year from 1990-1999 and this accelerated to 3.5% per year from 2000-2007.


The developing and least-developed economies, 80% of the world's population, accounted for 73%of the global growth of emissions in 2004. However, they contributed only 41% of total emissions, and just 23% of cumulative emissions since 1750.


Growth of the global economy in the early 2000s and an increase in its carbon intensity (emissions per unit of growth), combined with a decrease in the capacity of ecosystems on land and the oceans to act as carbon "sinks," have led to a rapid increase in the concentrations of carbon dioxide in the atmosphere. This has contributed to sooner-than-expected impacts including faster sea-level rise, ocean acidification, melting Arctic sea ice, warming of polar land masses, freshening of ocean currents and shifts in the circulation patterns of the oceans and atmosphere.


The observed increase in greenhouse gas concentrations are raising concern among some scientists that warming of between 1.4 and 4.3 °C above pre-industrial surface temperatures could occur. This exceeds the range of between 1 and 3 degrees perceived as the threshold for many "tipping points," including the end of summer Arctic sea ice, and the eventual melting of Himalayan glaciers and the Greenland ice sheet.


Ice


The melting of mountain glaciers appears to be accelerating, threatening the livelihoods of one fifth or more of the population who depend on glacier ice and seasonal snow for their water supply. For 30 reference glaciers in nine mountain ranges tracked by the World Glacier Monitoring Service, the mean rate of loss since 2000 has roughly doubled since the rate during the previous two decades. Current trends suggest that most glaciers will disappear from the Pyrenees by 2050 and from the mountains of tropical Africa by 2030.


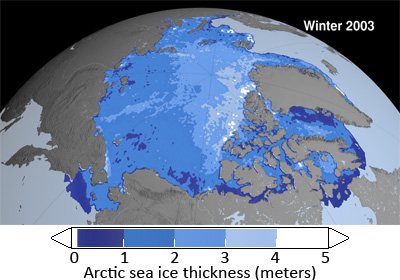
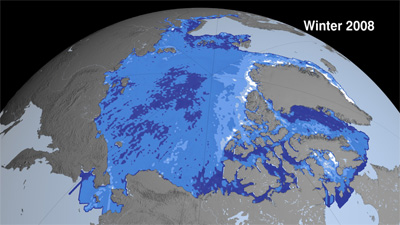
In 2007, summer sea ice in the Arctic Ocean shrank to its smallest extent ever, 24% less than the previous record in 2005, and 34% less than the average minimum extent in the period 1970-2000. In 2008, the minimum ice extent was 9% greater than in 2007, but still the second lowest on record.


Until the summer of 2007, most models projected an ice-free September for the Arctic Ocean towards the end of the current century. Reconsideration based on current trends has led to speculation that this could occur as soon as 2030.


Melting of the Greenland Ice Sheet surface also seems to be accelerating. In the summer of 2007, the rate of melting was some 60% higher than the previous record in 1998.


The loss of ice from West Antarctica is estimated to have increased by 60% in the decade to 2006, and by 140% from the Antarctic Peninsula in the same period.


Recent findings show that warming extends well to the south of the Antarctic Peninsula, to cover most of West Antarctica, an area of warming much larger than previously reported.


The hole in the ozone layer has had a cooling effect on Antarctica, and is partly responsible for masking expected warming on the continent. Recovery of stratospheric ozone, thanks to the phasing out of ozone-depleting substances, is projected to increase Antarctic temperatures in coming decades.


Oceans


Recent estimates of the combined impact of melting land-ice and thermal expansion of the oceans suggest a plausible average sea level rise of between 0.8 and 2.0 metres above the 1990 level by 2100. This compares with a projected rise of between 18 and 59 centimetres in the last IPCC report, which did not include an estimate of large-scale changes in ice-melt rates, due to lack of consensus.


Oceans are becoming more acidic more quickly than expected, jeopardizing the ability of shellfish and corals to form their external skeletons. Water that can corrode a shell-making carbonate substance called aragonite is already welling up during the summer along the California coast, decades earlier than models predict.


Ecosystems


Since the 2007 IPCC report, wide-ranging surveys have shown changes to the seasonal behaviour and distribution of all well-studied marine, freshwater and terrestrial groups of plants and animals. Polar and mountaintop species have seen severe contractions of their ranges.


A recent study projecting the impacts of climate change on the pattern of marine biodiversity suggests dramatic changes to come. Ecosystems in sub-polar waters, the tropics and semi-enclosed seas are predicted to suffer numerous extinctions by 2050, while the Arctic and Southern Oceans will experience severe species invasions. Marine ecosystems as a whole may see a species turnover of up to 60%.


Under the IPCC scenario that most closely matches current trends, i.e., with the highest projected emissions between 12 and 39% of the Earth's land surface could experience previously unknown climate conditions by 2100. A similar proportion, between 10 and 48%, will see existing climates disappear. Many of these "disappearing climates" coincide with biodiversity hotspots, and with the added problem of fragmented habitats and physical obstructions to migration, it is feared many species will struggle to adapt to the new conditions.


Perennial drought conditions have already been observed in South-eastern Australia and South-western North America. Projections suggest that persistent water scarcity will increase in a number of regions in coming years, including southern and northern Africa, the Mediterranean, much of the Middle East, a broad band in Central Asia and the Indian subcontinent.


Management


The reality of a rapidly-changing climate may make conventional approaches to conservation and restoration of habitats ineffective. Drastic measures such as large-scale translocation or assisted colonization of species may need to be considered.


Eco-agriculture, in which landscapes are managed to sustain a range of ecosystem services, including food production, may need to replace the current segregation of land use between conservation and production. This could help create resilient agricultural ecosystems better able to adapt to the changing climate conditions.


Experts increasingly agree that active protection of tropical forests is a cost-effective means of cutting global emissions. An international mechanism of reducing emissions from deforestation and forest degradation (REDD) is likely to emerge as a central component of a new agreement in Copenhagen. However, many issues need to be resolved, such as how to verify the reductions and ensuring fair treatment of local and indigenous forest communities.


A number of innovative approaches are emerging to keep carbon out of the atmosphere, including the use of "biochar," biologically-derived charcoal. It is mixed in soils, increasing fertility and potentially locking up carbon for centuries. This is a 21st century application of a technology known as Terra Preta, or Black Earth, used by Amazon peoples before the arrival of Europeans in South America.
 

To download the full report, visit http://www.unep.org/compendium2009/ 


For more information please contact: 
 
Nick Nuttall, UNEP Spokesperson and Head of Media, on Tel: +254 20 7623084, Mobile: +254 733 632755, or when travelling: +41 795965737, or e-mail: nick.nuttall@unep.org;

Elisabeth Guilbaud-Cox, Senior Communications Officer, UNEP Regional Office for North America, Tel: 1 (202) 974-1307, Mobile: 1 (202) 812-2100, e-mail: elisabeth.guilbaud-cox@unep.org

Link to press release:  http://www.unep.org/Documents.Multilingual/Default.asp?DocumentID=596&ArticleID=6326&l=en

The Guardian: Met Office warns of catastrophic global warming in our lifetimes

Met Office warns of catastrophic global warming in our lifetimes

• Study says 4 °C rise in temperature could happen by 2060
• Increase could threaten water supply of half world population

Path of global warming
Droughts and heatwaves are predicted to spread if average temperatures rise by 2C. The Met Office's study warns global warming could result in a rise of 4 °C by 2060. Photograph: Vinay Dithajohn/EPA

Unchecked global warming could bring a severe temperature rise of 4 °C within many people's lifetimes, according to a new report for the British government that significantly raises the stakes over climate change.
The study, prepared for the Department of Energy and Climate Change by scientists at the Met Office, challenges the assumption that severe warming will be a threat only for future generations, and warns that a catastrophic 4 °C rise in temperature could happen by 2060 without strong action on emissions.

Officials from 190 countries gather today in Bangkok to continue negotiations on a new deal to tackle global warming, which they aim to secure at United Nations talks in December in Copenhagen.

"We've always talked about these very severe impacts only affecting future generations, but people alive today could live to see a 4 °C rise," said Richard Betts, the head of climate impacts at the Met Office Hadley Centre, who will announce the findings today at a conference at Oxford University. "People will say it's an extreme scenario, and it is an extreme scenario, but it's also a plausible scenario."

According to scientists, a 4 °C rise over pre-industrial levels could threaten the water supply of half the world's population, wipe out up to half of animal and plant species, and swamp low coasts.

A 4 °C average would mask more severe local impacts: the Arctic and western and southern Africa could experience warming up to 10 °C, the Met Office report warns.

The study updates the findings of the 2007 report of the Intergovernmental Panel on Climate Change (IPCC), which said the world would probably warm by 4 °C by 2100 if greenhouse gas emissions continue to rise. The IPCC also listed a more severe scenario, with emissions and temperatures rising further because of more intensive fossil fuel burning, but this was not considered realistic. "That scenario was downplayed because we were more conservative a few years ago. But the way we are going, the most severe scenario is looking more plausible," Betts said.

A report last week from the UN Environment Programme said emissions since 2000 have risen faster than even this IPCC worst-case scenario. "In the 1990s, these scenarios all assumed political will or other phenomena would have brought about the reduction in greenhouse gas emissions by this point. In fact, CO2 emissions from fossil-fuel burning and industrial processes have been accelerating."

The Met Office scientists used new versions of the computer models used to set the IPCC predictions, updated to include so-called carbon feedbacks or tipping points, which occur when warmer temperatures release more carbon, such as from soils.

When they ran the models for the most extreme IPCC scenario, they found that a 4 °C rise could come by 2060 or 2070, depending on the feedbacks. Betts said: "It's important to stress it's not a doomsday scenario, we do have time to stop it happening if we cut greenhouse gas emissions soon." Soaring emissions must peak and start to fall sharply within the next decade to head off a 2 °C rise, he said. To avoid the 4 °C scenario, that peak must come by the 2030s.

A poll of 200 climate experts for the Guardian earlier this year found that most of them expected a temperature rise of 3 °C to 4 °C by the end of the century.

The implications of a 4 °C rise on agriculture, water supplies and wildlife will be discussed at the Oxford conference, which organisers have billed as the first to properly consider such a dramatic scenario.

Mark New, a climate expert at Oxford who has organised the conference, said: "If we get a weak agreement at Copenhagen then there is not just a slight chance of a 4 °C rise, there is a really big chance. It's only in the last five years that scientists have started to realise that 4 °C is becoming increasingly likely and something we need to look at seriously." Limiting global warming to 2 °C could only be achieved with new technology to suck greenhouse gases from the atmosphere. "I think the policy makers know that. I think there is an implicit understanding that they are negotiating not about 2 °C but 3 °C or 5 °C."

Link to article:  http://www.guardian.co.uk/environment/2009/sep/28/met-office-study-global-warming

V.M. Tiwari, J. Wahr, S. Swensen, GRL 2009: Dwindling groundwater resources in northern India, from satellite gravity observations

Geophysical Research Letters, 36 (2009) L18401; doi: 10.1029/2009GL039401.

Dwindling groundwater resources in northern India, from satellite gravity observations

V. M. Tiwari (National Geophysical Research Institute, CSIR, Hyderabad, India; Department of Physics, University of Colorado, Boulder, CO, U.S.A.), J. Wahr (Department of Physics and Cooperative Institute for Research in Environmental Sciences, University of Colorado, Boulder, CO, U.S.A.), and S. Swenson (Advanced Study Program, National Center for Atmospheric Research, Boulder, CO, U.S.A.)

Received 2 June 2009; accepted 28 July 2009; published 17 September 2009

Abstract

Northern India and its surroundings, home to roughly 600 million people, is probably the most heavily irrigated region in the world. Temporal changes in Earth's gravity field in this region as recorded by the GRACE satellite mission, reveal a steady, large-scale mass loss that we attribute to excessive extraction of groundwater. Combining the GRACE data with hydrological models to remove natural variability, we conclude the region lost groundwater at a rate of 54 ± 9 km3/yr between April, 2002 (the start of the GRACE mission) and June, 2008. This is probably the largest rate of groundwater loss in any comparable-sized region on Earth. Its likely contribution to sea level rise is roughly equivalent to that from melting Alaskan glaciers. This trend, if sustained, will lead to a major water crisis in this region when this non-renewable resource is exhausted.

Tiwari, V. M., J. Wahr, & S. Swenson (2009), Dwindling groundwater resources in northern India, from satellite gravity observations, Geophys. Res. Lett., 36, L18401; doi: 10.1029/2009GL039401.

Steiner, Kirchengas, Lackner, Pirscher, Borsche, Foelsche, GRL 2009, Atmospheric temperature change detection with GPS radio occultation 1995-2008

Geophysical Research Letters, 36 (2009)  L18702; doi: 10.1029/2009GL039777.

Atmospheric temperature change detection with GPS radio occultation 1995 to 2008

A. K. Steiner, G. Kirchengas, B. C. Lackner, B. Pirscher, M. Borsche, and U. Foelsche (Wegener Center for Climate and Global Change and Institute for Geophysics, Astrophysics, and Meteorology, University of Graz, Graz, Austria)

Received 26 June 2009; accepted 26 August 2009; published 22 September 2009

Abstract

Existing upper air records of radiosonde and operational satellite data recently showed a reconciliation of temperature trends but structural uncertainties remain. GPS radio occultation (RO) provides a new high-quality record, profiling the upper troposphere and lower stratosphere with stability and homogeneity. Here we show that climate trends are since recently detected by RO data, consistent with earliest detection times estimated by simulations. Based on a temperature change detection study using the RO record within 1995–2008 we found a significant cooling trend in the tropical lower stratosphere in February while in the upper troposphere an emerging warming trend is obscured by El Niño variability. The observed trends and warming/cooling contrast across the tropopause agree well with radiosonde data and basically with climate model simulations, the latter tentatively showing less contrast. The performance of the short RO record to date underpins its capability to become a climate benchmark record in the future.

Steiner, A. K., G. Kirchengast, B. C. Lackner, B. Pirscher, M. Borsche & U. Foelsche (2009), Atmospheric temperature change detection with GPS radio occultation 1995 to 2008, Geophys. Res. Lett., 36, L18702; doi: 10.1029/2009GL039777.

H. Douville, GRL (2009), Stratospheric polar vortex influence on Northern Hemisphere winter climate variability

Geophysical Research Letters, 36 (2009) L18703; doi: 10.1029/2009GL039334.

Stratospheric polar vortex influence on Northern Hemisphere winter climate variability

H. Douville (CNRM, GAME, Météo-France, CNRS, Toulouse, France)

Received 8 June 2009; accepted 18 August 2009; published 23 September 2009.

Abstract

Given the low skill of seasonal forecasts in the Northern Hemisphere, it is important to look for extra sources of long-range predictability in addition to the global distribution of sea surface temperature (SST). Former studies have suggested the potential contribution of the stratosphere but have never really quantified this influence and compared it to the SST forcing. In the present study, two ensembles of global atmospheric simulations driven by observed SST and radiative forcings have been performed over the 1971–2000 period. In the perturbed experiment, the stratospheric dynamics and temperature is nudged towards the ERA40 reanalyses north of 25°N in order to mimic a “perfect” polar vortex. The comparison with the control experiment reveals a strong improvement in the simulation of the Arctic and North Atlantic Oscillation, with obvious positive impacts on the interannual variability of winter surface air temperature and precipitation, especially over Europe.

Douville, H. (2009), Stratospheric polar vortex influence on Northern Hemisphere winter climate variability, Geophys. Res. Lett., 36, L18703; doi: 10.1029/2009GL039334.

Link to abstract:  http://www.agu.org/pubs/crossref/2009/2009GL039334.shtml

Marco Tedesco & Andrew J. Monaghan, GRL (2009): An updated Antarctic melt record through 2009 and its linkages to high-latitude and tropical climate variability

Geophysical Research Letters, 36 (2009) L18502; doi: 10.1029/2009GL039186.

An updated Antarctic melt record through 2009 and its linkages to high-latitude and tropical climate variability

Marco Tedesco (Earth and Atmospheric Sciences, City College of New York, New York, NY, U.S.A.) and Andrew J. Monaghan (National Center for Atmospheric Research, Boulder, CO, U.S.A.)

Received 13 May 2009; accepted 12 August 2009; published 24 September 2009

Abstract

A 30-year minimum Antarctic snowmelt record occurred during austral summer 2008–2009 according to spaceborne microwave observations for 1980–2009. Strong positive phases of both the El-Niño Southern Oscillation (ENSO) and the Southern Hemisphere Annular Mode (SAM) were recorded during the months leading up to and including the 2008–2009 melt season. The 30-year record confirms that significant negative correlations exist at regional and continental scales between austral summer melting and both the ENSO and SAM indices for October–January. In particular, the strongest negative melting anomalies (such as those in 2008 and 2009) are related to amplified large-scale atmospheric forcing when both the SAM and ENSO are in positive phases. Our results suggest that enhanced snowmelt is likely to occur if recent positive summer SAM trends subside in conjunction with the projected recovery of stratospheric ozone levels, with subsequent impacts on ice sheet mass balance and sea level trends.

Tedesco, M., & A. J. Monaghan (2009), An updated Antarctic melt record through 2009 and its linkages to high-latitude and tropical climate variability, Geophys. Res. Lett., 36, L18502; doi: 10.1029/2009GL039186.

Link to abstract:  http://www.agu.org/pubs/crossref/2009/2009GL039186.shtml

Dlugokencky et al., GRL (September 2009): Observational constraints on recent increases in the atmospheric CH4 burden

Geophysical Research Letters, 36 (2009) L18803; doi: 10.1029/2009GL039780.

Observational constraints on recent increases in the atmospheric CH4 burden 

 E. J. Dlugokencky, L. Bruhwiler (NOAA Earth System Research Laboratory, Boulder, CO, U.S.A.), J. W. C. White (INSTAAR, University of Colorado, Boulder, CO, U.S.A.), L. K. Emmons (National Center for Atmospheric Research, Boulder, CO, U.S.A.), P. C. Novelli, S. A. Montzka, K. A. Masarie, P. M. Lang, A. M. Crotwell, J. B. Miller (NOAA Earth System Research Laboratory, Boulder, CO, U.S.A.) and L. V. Gatti (Divisao de Quimica Ambiental, Laboratorio de Quimica Atmosferica, Insituto de Pesquisas Energéticas e Nucleares, São Paulo, Brazil )

Received 6 July 2009; accepted 18 August 2009; published 17 September 2009

Abstract

Measurements of atmospheric CH4 from air samples collected weekly at 46 remote surface sites show that, after a decade of near-zero growth, globally averaged atmospheric methane increased during 2007 and 2008. During 2007, CH4 increased by 8.3 ± 0.6 ppb. CH4 mole fractions averaged over polar northern latitudes and the Southern Hemisphere increased more than other zonally averaged regions. In 2008, globally averaged CH4 increased by 4.4 ± 0.6 ppb; the largest increase was in the tropics, while polar northern latitudes did not increase. Satellite and in situ CO observations suggest only a minor contribution to increased CH4 from biomass burning. The most likely drivers of the CH4 anomalies observed during 2007 and 2008 are anomalously high temperatures in the Arctic and greater than average precipitation in the tropics. Near-zero CH4 growth in the Arctic during 2008 suggests we have not yet activated strong climate feedbacks from permafrost and CH4 hydrates.

Dlugokencky, E. J., et al. (2009), Observational constraints on recent increases in the atmospheric CH4 burden, Geophys. Res. Lett., 36, L18803; doi: 10.1029/2009GL039780.

Link to abstract:  http://www.agu.org/pubs/crossref/2009/2009GL039780.shtml

NOAA: Unusual Arctic warmth, tropical wetness likely cause for methane increase, E. Dlugokencky et al., GRL

Unusual Arctic warmth, tropical wetness likely cause for methane increase

NOAA, September 25, 2009
Wetlands at the Parker River restoration site.

Wetlands at the Parker River restoration site. High resolution (Credit: NOAA)

Unusually high temperatures in the Arctic and heavy rains in the tropics likely drove a global increase in atmospheric methane in 2007 and 2008 after a decade of near-zero growth, according to a new study. Methane is the second most abundant greenhouse gas after carbon dioxide, albeit a distant second.

NOAA scientists and their colleagues analyzed measurements from 1983 to 2008 from air samples collected weekly at 46 surface locations around the world. Their findings will appear in the September 28 print edition of the American Geophysical Union’s Geophysical Research Letters and are available online now.

“At least three factors likely contributed to the methane increase,” said Ed Dlugokencky, a methane expert at NOAA’s Earth System Research Laboratory in Boulder, Colo. “It was very warm in the Arctic, there was some tropical forest burning, and there was increased rain in Indonesia and the Amazon.”

In the tropics, the scientists note, the increased rainfall resulted in longer periods of rainfall and larger wetland areas, allowing microbes to produce more methane. Starting in mid-2007, scientists noticed La Niña conditions beginning, waning and then intensifying in early 2008. This kind of climate condition typically brings wetter-than-normal conditions in some tropical regions and cooler sea surface temperatures in the central and eastern tropical Pacific Ocean. It can persist for as long as two years. In the United States, La Niña often signals drier-than-normal conditions in the Southwest and Central Plains regions, and wetter fall and winter seasons in the Pacific Northwest.

Observations from satellites and ground sites suggest that biomass burning – the burning of plant and other organic material that releases carbon dioxide and methane – contributed about 20% of the total methane released into the atmosphere in 2007.
A magnificent view of wetlands and tidal streams in the Ashe Island area.

A magnificent view of wetlands and tidal streams in the Ashe Island area. High resolution (Credit: NOAA)

However, during the scientists’ 2007 measurement of methane for northern wetland regions, including the Arctic, temperatures for the year were the warmest on record. This temperature increase coincided with the large jump in the amount of methane measured in that area.

Dlugokencky and his colleagues from the United States and Brazil note that while climate change can trigger a process which converts trapped carbon in permafrost to methane, as well as release methane embedded in Arctic hydrates – a compound formed with water - their observations “are not consistent with sustained changes there yet.”

Methane is typically created in oxygen-deprived environments, such as flooded wetlands, peat bogs, rice paddies, landfills, termite colonies, and the digestive tracts of cows and other ruminant animals. The gas also escapes during fossil fuel extraction and distribution and is emitted during fires.

Authors of the study are: E. Dlugokencky, L. Bruhwiler, P.C. Novelli, S. A. Montzka, K. A. Masarie, P. M. Lang, A.M. Crotwell, and J.B. Miller of NOAA’s Earth System Research Laboratory, Boulder, Colo.; J.W.C. White of the Institute of Arctic and Alpine Research, University of Colorado, Boulder, Colo.; L. K. Emmons of the National Center for Atmospheric Research, Boulder, Colo.; and L.V. Gatti of the Laboratorio de Quimica Atmosferica, Instituto de Pesquisas Energéticas e Nucleares, São Paulo, Brazil. Crotwell and Miller are also at the Cooperative Institute for Research in Environmental Sciences in Boulder, Colo. The paper is available online.

NOAA understands and predicts changes in the Earth's environment, from the depths of the ocean to the surface of the sun, and conserves and manages our coastal and marine resources.

Link:  http://www.noaanews.noaa.gov/stories2009/20090925_arctic.html

Tuesday, September 29, 2009

TWC: Bird's eye view of the North Pole and how the weakening of the polar vortex is allowing not so good things to go on weatherwise

OK, readers, that was a really silly title, I know.

But, I don't know how else to state it. Please click on the image to enlarge it. If you look carefully at the clouds, you can see that France is dry and so is the entire western half of the U.S.

If the polar vortex is too weak to keep the warm air currents far enough south, then they keep going north.

Sure, sometimes the west is dry and so is France, but I just thought this was a nice image to demonstrate what is likely to be a more dominant weather pattern when the Arctic warms up.


Blogger Enno said...
heh that was funny! but -- "what is likely to be a more dominant weather pattern" ... can you state or link to some substantiation why/how one knows that this specific pattern is likely to be more dominant? Thank you for your blog, generally.
September 29, 2009 3:14 PM
Delete
Blogger Tenney Naumer said...
Dear Enno, Thanks for your comment! For substantiation, please click on the relevant labels, e.g., "storm tracks...," polar vortex, and other related labels. There is plenty of research being done on these things, and whenever I run across it, I make a point to post it to the blog. Best regards, Tenney
September 30, 2009 8:47 AM

Joseph Romm: Met Office: Catastrophic climate change, 13-18 °F over most of U.S. and 27 °F in the Arctic, could happen in 50 years, but “we do have time to stop it if we cut greenhouse gas emissions soon”


UK Met Office: Catastrophic climate change, 13-18 °F over most of U.S. and 27 °F in the Arctic, could happen in 50 years, but “we do have time to stop it if we cut greenhouse gas emissions soon”

by Joseph Romm, Climate Progress, September 28, 2009 
 
Finally, some of the top climate modelers in the world have done a “plausible worst case scenario,” as Dr Richard Betts, Head of Climate Impacts at the Met Office Hadley Centre, put it today in a terrific and terrifying talk (audio here, PPT here).

No, I’m not taking about a simple analysis of what happens if the nation and the world just keep on our current emissions path.  We’ve known that end-of-century catastrophe for a while (see “M.I.T. doubles its 2095 warming projection to 10 °F — with 866 ppm and Arctic warming of 20 °F").  I’m talking about running a high emissions scenario (i.e., business as usual) in one of the few global climate models capable of analyzing strong carbon cycle feedbacks.  This is what you get [temperature in degrees Celsius, multiple by 1.8 for Fahrenheit]:
Graphic of chnage in temperature
The key point is that while this warming occurs between 1961-1990 and 2090-2099 for the high-end scenarios without carbon cycle feedbacks, in about 10% of Hadley’s model runs with the feedbacks, it occurs around 2060.  Betts calls that the “plausible worst case scenario.”  It is something the IPCC and the rest of the scientific community should have laid out a long time ago.

As the Met Office notes here, “In some areas warming could be significantly higher (10 °C = 15 °F) or more)”:

  • The Arctic could warm by up to 15.2 °C (27.4 °F) for a high-emissions scenario, enhanced by melting of snow and ice causing more of the Sun’s radiation to be absorbed.
  • For Africa, the western and southern regions are expected to experience both large warming (up to 10 °C (18 °F)) and drying.
  • Some land areas could warm by 7 °C (12.6 °F) or more.
  • Rainfall could decrease by 20% or more in some areas, although there is a spread in the magnitude of drying. All computer models indicate reductions in rainfall over western and southern Africa, Central America, the Mediterranean and parts of coastal Australia.
  • In other areas, such as India, rainfall could increase by 20% or more. Higher rainfall increases the risk of river flooding.
Large parts of the inland United States would warm by 15-18 °F, even worse than the NOAA-led 13-agency impacts report found “Our hellish future: Definitive NOAA-led report on U.S. climate impacts warns of scorching 9-11 °F warming over most of inland U.S. by 2090 with Kansas above 90 °F some 120 days a year — and that isn’t the worst case, it’s business as usual!
Dr Betts added: “Together these impacts will have very large consequences for food security, water availability and health. However, it is possible to avoid these dangerous levels of temperature rise by cutting greenhouse gas emissions. If global emissions peak within the next decade and then decrease rapidly it may be possible to avoid at least half of the four degrees of warming.”
A DECC spokesman said: “This report illustrates why it is imperative for the world to reach an ambitious climate deal at Copenhagen which keeps the global temperature increase to below two degrees.”
Betts “presented the new findings at a special conference” today.  “4 degrees and beyond at Oxford University, attended by 130 international scientists and policy specialists, is the first to consider the global consequences of climate change beyond 2 °C.”  You can find all the talks here.

The UK Telegraph story is here The Guardian story is “Met Office warns of catastrophic global warming in our lifetimes:  Study says 4 °C rise in temperature could happen by 2060, Increase could threaten water supply of half world population”:
When they ran the models for the most extreme IPCC scenario, they found that a 4 °C rise could come by 2060 or 2070, depending on the feedbacks. Betts said: “It’s important to stress it’s not a doomsday scenario, we do have time to stop it happening if we cut greenhouse gas emissions soon.” Soaring emissions must peak and start to fall sharply within the next decade to head off a 2 °C rise, he said. To avoid the 4 °C scenario, that peak must come by the 2030s.
Again, this is not the likely impact for 2060 if we fail to act aggressively, but it is a plausible worst-case scenario that should invalidate all economic cost-benefit analysis done to date.

Kudos to Betts and the Met Office for this important, uncharacteristically blunt, and long-overdue analysis.

Link:  http://climateprogress.org/2009/09/28/uk-met-office-catastrophic-climate-change-could-happen-with-50-years/

Monday, September 28, 2009

Robert Dickson: New techniques for observing the Arctic Ocean circulation and its freshwater budget

Nuuk Climate Days 2009: Changes of the Greenland Cryosphere Workshop & The Arctic Freshwater Budget International Symposium, Nuuk, Greenland, 25-27 August 2009

Primary author: DICKSON, Robert (CEFAS, Lowestoft), r.r.dickson@cefas.co.uk

Abstract ID: O8

New techniques for observing the Arctic Ocean circulation and its freshwater budget


In one way or another, the two-way influences of global climate on the Arctic, and of the Arctic on global climate, center on its ice and freshwater budget. As the Arctic sea-ice declines, climate models anticipate regional effects on the atmospheric circulation (e.g. through changes in albedo and ocean-atmosphere heat exchange); and since the pioneering work of Bryan and Manabe in the 1980s, we have come to expect remote effects also, as a changing freshwater efflux from the Arctic reaches south to affect the Atlantic thermohaline circulation. That said, however, it remains true that climate models are inherently weak in quite a long list of the processes that are important to our understanding of how change takes place in northern seas and how it might affect climate. And the fact that the Arctic-subarctic system is both under-sampled and rapidly-changing is also problematic when establishing freshwater budgets; put simply, the large variability in the supply, storage and transfer of freshwater throughout this system may prevent us from discriminating inconsistency from change in our estimates.

After a brief recap of a representative freshwater budget for the Arctic and of how climate models expect the freshwater delivery to the Arctic to change, this talk concentrates on five areas where our understanding of the freshwater budget and the processes important to it appear to have been materially advanced during recent years, including but not necessarily restricted to the IPY. These include: (1) new ideas on the behaviour of the greatest oceanic freshwater reservoir on Earth (Proshutinsky, Toole); (2) new intricate ideas on ocean-climate feedback processes along the Arctic margin of the Beaufort and Chukchi seas as the land-fast ice thins and breaks free (Shimada); (3) new ice-thickness techniques in support of sea ice prediction (Laxon/Giles,  Wadhams, Gascard); (4) a new and practical approach to monitoring the freshwater flux through the Canadian Arctic Archipelago by combining observations with models (Prinsenberg, Peterson); and (5) new direct observations of the freshwater flux passing south through the Fram Strait (de Steur et al., Rabe et al.). Such a diverse set of examples serves to illustrate the broad front over which progress is needed -- and is being made -- in developing our understanding of these processes, their changes, their feedbacks and their likely climatic impacts to the point where they can be of practical use to the development of climate models. Meanwhile, in many cases, we are still in the process of exploration.


Contact for symposium information: Sune Nordentoft Lauritsen, e-mail: snl@space.dtu.dk

K. Delthloff et al.,The climate system of the Earth from a polar perspective

Nuuk Climate Days 2009: Changes of the Greenland Cryosphere Workshop & The Arctic Freshwater Budget International Symposium, Nuuk, Greenland, 25-27 August 2009


Primary author: DELTHLOFF, Klaus (Alfred Wegener Institute for Polar and Marine Research (AWI),
Germany), Klaus.Dethloff@awi.de.  Co-authors: RINKE, A. (Alfred Wegener Institute for Polar and Marine Research); HANDORF, D. (Alfred Wegener Institute for Polar and Marine Research); DORN, W. (Alfred Wegener Institute for Polar and Marine Research); BRAND, S. (Alfred Wegener Institute for Polar and Marine Research); MIELKE, M. (Alfred Wegener Institute for Polar and Marine Research); GRAESER, J (Alfred Wegener Institute for Polar and Marine Research); HERBER, A. (Alfred Wegener Institute for Polar and Marine Research)

Abstract ID: F1

The climate system of the Earth from a polar perspective


Balloon and radio sounding data from the North Pole drifting station NP35 for autumn 2007 to spring 2008 have been used to evaluate numerical model outputs (simulations with the regional climate model HIRHAM, ECMWF analyses). HIRHAM in the climate mode has some difficulty to represent the observed complex temperature profile, while the forecast mode shows better agreement. Sensitivity experiments concerning the atmospheric initial state, sea ice thickness and planetary boundary layer parameterization demonstrate improvements in the simulations.

Similar measurements have been carried out during spring 2009 on NP 36 and with the AWI airplane POLAR 5 over the Arctic Ocean. The pilot-project PAM-RCM (Pan-Arctic Measurements and Arctic Regional climate model simulations) provided a unique opportunity to obtain a snapshot of aerosol and cloud distributions and associated meteorological and atmospheric conditions as well as measurements of sea ice thickness in a latitude band between about 70°N and 80°N.

Sensitivity experiments using a coupled regional atmosphere-ocean-ice model of the Arctic has been conducted in order to identify the requirements needed to reproduce observed sea-ice conditions and to address uncertainties in the description of Arctic processes. While more sophisticated schemes for the albedo, the treatment of lateral freezing and melting, and the snow cover have been successfully introduced into the model, the parameterization of clouds is an open issue.

The global influence of Arctic feedbacks connected with sea-ice albedo changes and stratospheric ozone changes have been investigated. The simulations show significant changes over the Arctic and the whole globe due to changes of planetary wave patterns, which trigger the Arctic Oscillation (AO) and influences the sea -ice cover.

The impact of an interactive stratospheric ozone chemistry on the tropospheric circulation has been studied on the basis of the atmosphere-ocean-sea ice general circulation model ECHO-GiSP. The results show a sensitivity of the tropospheric circulation dynamics to the stratospheric chemistry. With enabled interactive stratospheric chemistry the model tends to the negative phase of the AO mode and a more unstable polar vortex..

Contact for symposium information:  Sune Nordentoft Lauritsen, e-mail: snl@space.dtu.dk

Greenland Ice Sheet’s elevation change in winter and atmospheric circulation

Nuuk Climate Days 2009 -- Changes of the Greenland Cryosphere Workshop & The Arctic Freshwater Budget International Symposium, Nuuk, Greenland, 25-27 August 2009

Primary author: CHEN, Linling (Nansen-Zhu International research center/Institute of Atmospheric Physics,
Chinese Academy of Sciences), lin-ling.chen@nersc.no ; Co-authors: JOHANNESSEN, Ola M. (Nansen Environmental and Remote Sensing Center); WANG, Huijun (Nansen-Zhu International research center/Institute of Atmospheric Physics, Chinese Academy of Sciences);  KHVOROSTOVSKY, Kirill (Nansen Environmental and Remote Sensing Center)

Abstract ID: F4
 

Greenland Ice Sheet’s elevation change in winter and atmospheric circulation

Data from ERS-1, ERS-2 and Envisat Satellites are analyzed to identify the relationship between winter elevation variations of Greenland ice sheet and sea level pressure during 1993-2007. It is found that the North Pacific oscillation and the North Atlantic oscillation, the two major teleconnection patterns of surface pressure fields in North Hemisphere, both have significant impacts on the Greenland ice sheet winter elevation change by influencing accumulation. In addition, we are evaluating modeled precipitation data over Greenland based on comparison with accumulation data from all available ice core records and meteorological station, in order to better understand how the atmospheric circulation impact the Greenland Ice Sheet’s Elevation.

V. V. Petrenko et al., Science (2009) 324(5926): 14CH4 measurements in Greenland ice: Investigating last glacial termination CH4 sources

Science (24 April 2009), Vol. 324, No. 5926, pp. 506–508; DOI: 10.1126/science.1168909

Reports

14CH4 measurements in Greenland ice: Investigating last glacial termination CH4 sources

Vasilii V. Petrenko,1,*,** Andrew M. Smith,2 Edward J. Brook,3 Dave Lowe,4 Katja Riedel,4 Gordon Brailsford,4 Quan Hua,2 Hinrich Schaefer,4 Niels Reeh,5 Ray F. Weiss,1 David Etheridge,6 Jeffrey P. Severinghaus1

Abstract

The cause of a large increase of atmospheric methane concentration during the Younger Dryas–Preboreal abrupt climatic transition (~11,600 years ago) has been the subject of much debate. The carbon-14 (14C) content of methane (14CH4) should distinguish between wetland and clathrate contributions to this increase. We present measurements of 14CH4 in glacial ice, targeting this transition, performed by using ice samples obtained from an ablation site in west Greenland. Measured 14CH4 values were higher than predicted under any scenario. Sample 14CH4 appears to be elevated by direct cosmogenic 14C production in ice. 14C of CO was measured to better understand this process and correct the sample 14CH4. Corrected results suggest that wetland sources were likely responsible for the majority of the Younger Dryas–Preboreal CH4 rise.


1 Scripps Institution of Oceanography, University of California, San Diego, La Jolla, CA 92093, USA.
2 Australian Nuclear Science and Technology Organisation (ANSTO), Private Mail Box 1, Menai, NSW 2234, Australia.
3 Department of Geosciences, Oregon State University, Corvallis, OR 97331, USA.
4 National Institute of Water and Atmospheric Research Ltd., Post Office Box 14901, Kilbirnie, 301 Evans Bay Parade, Wellington, New Zealand.
5 DTU Space, National Space Institute, Technical University of Denmark, Ørsteds Plads, Building 348, DK-2800 Kongens Lyngby, Denmark.
6 Commonwealth Scientific and Industrial Research Organisation, Marine and Atmospheric Research, Private Mail Box 1, Aspendale, VIC 3195, Australia.

* Present address: Institute of Arctic and Alpine Research, University of Colorado, Boulder, CO 80309, USA.

**Correspondence e-mail: vasilii.petrenko@colorado.edu

Link to abstract:  http://www.sciencemag.org/cgi/content/abstract/324/5926/506

H. Schaefer et al., J. Glaciology (2009): Ice stratigraphy at the Pakitsoq ice margin, West Greenland, derived from gas records

Journal of Glaciology (2009), Vol. 55, No. 191, pp. 411-421.

Ice stratigraphy at the Pakitsoq ice margin, West Greenland, derived from gas records

H. Schaefer, V. V. Petrenko, E. J. Brook, J. P. Severinghaus, N. Reeh, J. R. Melton, and L. Mitchell

Technical University of Denmark, National Space Institute, Denmark

Abstract

Horizontal ice-core sites, where ancient ice is exposed at the glacier surface, offer unique opportunities for paleo-studies of trace components requiring large sample volumes. Following previous work at the Pakitsoq ice margin in West Greenland, we use a combination of geochemical parameters measured in the ice matrix (delta O-18(ice)) and air occlusions (delta O-18(atm), delta N-15 of N-2 and methane concentration) to date ice layers from specific climatic intervals. The data presented here expand our understanding of the stratigraphy and three-dimensional structure of ice layers outcropping at Pakitsoq. Sections containing ice from every distinct climatic interval during Termination I, including Last Glacial Maximum, Bolling/Allerod, Younger Dryas and the early Holocene, are identified. In the early Holocene, we find evidence for climatic fluctuations similar to signals found in deep ice cores from Greenland. A second glacial-interglacial transition exposed at the extreme margin of the ice is identified as another outcrop of Termination I (rather than the onset of the Eemian interglacial as postulated in earlier work). Consequently, the main structural feature at Pakitsoq is a large-scale anticline with accordion-type folding in both exposed sequences of the glacial-Holocene transition, leading to multiple layer duplications and age reversals.

Link to abstract:  http://www.space.dtu.dk/Forskning/Publikationer/2009.aspx?lg=showcommon&id=248910

Rate of Greenland ice mass balance loss increasing, Arctic climate is changing drastically and rapidly are findings of meeting in Nuuk, Greenland

The Arctic climate is changing drastically and rapidly

by Sune Nordentoft Lauritsen, National Space Institute, Technical University of Denmark, August 31, 2009

The Arctic climate is changing drastically at a rapid pace and the effects will be felt on a global scale. That was the overall conclusion from a scientific conference on climate changes in the Arctic which was held in Nuuk, Greenland, last week. The conference was organized by the National Space Institute at Technical University of Denmark, the Danish Meteorological Institute and the Greenland Climate Center.
The conference showed that the Arctic climate is changing rapidly in a number of different ways:

  • The recent rate of decrease in thickness and volume of the Arctic sea ice has been faster than the rate of aerial shrinkage determined from satellites. Given that the present trend of melt continues, some models indicate that it is quite likely that the Arctic Ocean could be ice free in the summer time as early as 2015-16.


  • There has been a rapid increase in the mass-loss from the Greenland ice sheet during the last decade. Increased surface melting accounts for around 40% of this increase, while iceberg calving from glaciers account for the remaining 60%.


  • The total mass-loss from the Greenland ice sheet has averaged 240 km³ of ice per year during the last 5 years. The mass-loss has been accelerating in the last couple of years.


  • If the present warming trend continues, melt-water from the Greenland ice sheet will contribute to a sea-level rise of around 1 meter in this century – together with melt-water from other ice sheets and ocean thermal expansion.


  • The mass-loss of the ice-sheet at the margins is increasing and spreading north. Up until now, the mass-loss has been concentrated in the southern part of the Greenland ice-sheet. And while the inland part of the ice sheet is still growing at a small rate each year, this rate is now also declining.  


  • The warming oceans play a bigger role in melting and accelerating the glacier tongues from the Greenland ice sheet than has previously been thought. Furthermore, melt water from the ice sheet which penetrates the glaciers through crevasses accelerates the outflow by lubricating the bottom of the glacier.


  • The permafrost in Greenland as well as globally is warming and in some areas thawing. Currently, construction regulations do not take this into account. Road damage has been observed and further damage on infrastructure is likely in the near future because of these combined effects.

The conference was supported by the National Science Foundation and the Nordic Council of Ministers.

Further information

State geodesist Rene Forsberg, National Space Institute, Technical University of Denmark, (+45) 25402775
Chief adviser Sune Nordentoft Lauritsen, National Space Institute, Technical University of Denmark, (+45) 23743569.

Send e-mail: Sune Nordentoft Lauritsen, snl@space.dtu.dk

Link to article:  http://www.space.dtu.dk/English/News/News.aspx?guid={2F1E2995-068B-4F0F-8ABF-369481D27C6B}

Rapid increase in Greenland's mass balance loss

Summer sea ice likely to disappear from the Arctic by 2015; Rapid increase in Greenland's mass balance loss


mongabay.com, August 31, 2009


If current melting trends continue, the Arctic Ocean is likely to be free of summer sea ice by 2015, according to research presented at a conference in Nuuk, Greenland, organized by the National Space Institute at Technical University of Denmark, the Danish Meteorological Institute and the Greenland Climate Center.

The estimates, which are consistent with some models presented at the American Geophysical Union meeting in 2007 and research published last year, are based on the rapid thinning (loss of volume) of Arctic sea ice, which has outpaced shrinkage in extent of sea ice, in recent years. Last month NASA announced that overall Arctic sea ice thinned about 17.8 cm (7 inches) a year, for a total of 67 cm (2.2 feet) over the four winters from 2004 to 2008. NASA said the total area covered by thick older ice that survives one or more summers ("multi-year ice") shrank 42% or 1.54 million km² (595,000 square miles), leaving thinner first-year ice ("seasonal ice") as the dominant type of ice in the region. The share of seasonal ice increased from 38% of the Arctic's total ice volume in 2003 to 68% in 2008.


Data visualization of Arctic sea ice thickness, as measured by ICESat, shows the decline of the thickest ice (white, 4-5 meters thick) and increase in thinner ice (deep blue, 0-1 meter) from 2003 to 2008. Credit: NASA"s Goddard Scientific Visualization Studio.
Researchers say shifting currents and warmer waters are triggering ice melt, a process which builds on itself since sea ice helps reflect sunlight back into space, cooling the region. When sea ice melts, the dark areas of open water absorb the sun's radiation, trigger a positive feedback loop that worsens melting. When there is less cloud cover, the effect is intensified.

Environmentalists are concerned that the loss of summer sea ice could have dramatic implications for wildlife -- like polar bear and walrus -- that depend on pack ice for feeding. At the same time, some developers welcome declining ice cover in that it could make it easier to exploit the Arctic's rich mineral, oil and gas deposits. Melting has already triggered a scramble between Canada, Russia, the U.S., Denmark, Sweden and Norway over rights to seabed resources.

Greenland's ice sheet

Scientists at the conference in Denmark also reported a "rapid increase" in ice loss for the Greenland ice sheet, including the loss of some 1200 cubic kilometers' worth of ice over the past years. About 60% of the ice loss came from iceberg calving from glaciers, while 40% resulted from increased surface melting.

Researchers further reported that melting and calving is spreading across Greenland: "Up until now, the mass-loss has been concentrated in the southern part of the Greenland ice-sheet. And while the inland part of the ice sheet is still growing at a small rate each year, this rate is now also declining," according to a statement from the Technical University of Denmark.

Conference presenters also said there is evidence that Greenland's permafrost is thawing, raising the risk of increased greenhouse gas emissions from frozen methane deposits. 


Link:  http://news.mongabay.com/2009/0831-arctic.html

Friday, September 25, 2009

Seth Borenstein: If greenhouse gases are cut as planned, Earth still gets 6 degrees hotter, update suggests


If greenhouse gases are cut as planned, Earth still gets 6 degrees hotter, update suggests

by Seth Borenstein, AP, September 25, 2009

WASHINGTON — Earth's temperature is likely to jump nearly 6 °F between now and the end of the century even if every country cuts greenhouse gas emissions as proposed, according to a United Nations update.

Scientists looked at emission plans from 192 nations and calculated what would happen to global warming. The projections take into account 80% pollution cuts from the U.S. and Europe by 2050, which are not sure things.

The U.S. figure is based on a bill that passed the House of Representatives but is running into resistance in the Senate, where debate has been delayed by health care reform efforts.

Carbon dioxide, mostly from the burning of fossil fuels such as coal and oil, is the main cause of global warming, trapping the sun's energy in the atmosphere. The world's average temperature has already risen 1.4 °F (0.8 °C) since the 19th century.

Much of projected rise in temperature is because of developing nations, which aren't talking much about cutting their emissions, scientists said at a United Nations press conference Thursday. China alone adds nearly 2 °F (1 °C) to the projections.

"We are headed toward very serious changes in our planet," said Achim Steiner, head of the U.N.'s environment program, which issued the update on Thursday.

Even if the developed world cuts its emissions by 80% and the developing world cuts theirs in half by 2050, as some experts propose, the world is still facing a 3 °F (1.7 °C) increase by the end of the century, said Robert Corell, a prominent U.S. climate scientist who helped oversee the update.

Corell said the most likely agreement out of the international climate negotiations in Copenhagen in December still translates into a nearly 5 °F (2.7 °C) increase in world temperature by the end of the century. European leaders and the Obama White House have set a goal to limit warming to just a couple degrees.

The U.N.'s environment program unveiled the update on peer-reviewed climate change science to tell diplomats how hot the planet is getting. The last big report from the Nobel Prize-winning Intergovernmental Panel on Climate Change came out more than two years ago and is based on science that is at least three to four years old, Steiner said.

Global warming is speeding up, especially in the Arctic, and that means that some top-level science projections from 2007 are already out of date and overly optimistic. Corell, who headed an assessment of warming in the Arctic, said global warming "is accelerating in ways that we are not anticipating."

Because Greenland and West Antarctic ice sheets are melting far faster than thought, it looks like the seas will rise twice as fast as projected just three years ago, Corell said. He said seas should rise about a foot every 20-25 years.

Other problems that have worsened since the 2007 report include the oceans getting more acidic — a threat to some sea creatures — and projections for regular long-term droughts in the U.S. Southwest.

"As sobering as this report is, it is not the worst case scenario," said U.S. Rep. Edward J. Markey, co-author of the bill that passed the U.S. House. "That would be if the world does nothing and allows heat-trapping pollution to continue to spew unchecked into the atmosphere."

Link:  http://www.washingtonexaminer.com/economy/ap/61444462.html

UNEP: Climate Change Science Compendium 2009


United Nations Environment Programme (UNEP)

Climate Change Science Compendium 2009 (click on each image to go to the related chapter)

UNEP in French (just for you, FT), click here.

The Climate Change Science Compendium is a review of some 400 major scientific contributions to our understanding of Earth Systems and climate that have been released through peer-reviewed literature or from research institutions over the last three years, since the close of research for consideration by the IPCC Fourth Assessment Report.

The Compendium is not a consensus document or an update of any other process. Instead, it is a presentation of some exciting scientific findings, interpretations, ideas, and conclusions that have emerged among scientists.
Focusing on work that brings new insights to aspects of Earth System Science at various scales, it discusses findings from the International Polar Year and from new technologies that enhance our abilities to see the Earth’s Systems in new ways. Evidence of unexpected rates of change in Arctic sea ice extent, ocean acidification, and species loss emphasizes the urgency needed to develop management strategies for addressing climate change.
Download the full report
Order online from earthprint.com

Thursday, September 24, 2009

USGS: Atlanta Flooding Sets New Records

Atlanta Flooding Sets New Records

U.S. Department of the Interior, U.S. Geological Survey, News Release, September 24, 2009 

The flooding around Atlanta this week is one for the record books. According to the U.S. Geological Survey (USGS), the rivers and streams had magnitudes so great that the odds of it happening were less than 0.2 percent in any given year. In other words, there was less than a 1 in 500 chance that parts of Cobb and Douglas counties were going to be hit with such an event.

“The USGS can reliably say just how bad these floods were. They were epic!” said Brian McCallum, Assistant Director for the USGS Water Science Center in Georgia. “We have all witnessed the devastation caused by these floods, but now we can quantify it.” The data are gathered from the USGS real-time streamgaging network.

On Sept. 22, USGS crews measured the greatest flow ever recorded (28,000 cubic feet per second) on Sweetwater Creek near Austell, Ga.

Elsewhere in the Atlanta area:
Ø The Yellow River streamgages in Gwinnett, DeKalb and Rockdale counties measured flows between the 1 percent chance (100-year) and 0.5 percent chance (200-year) flood magnitude.
Ø Flows caused by the rain at Peachtree Creek in Atlanta were only near the 10 percent chance (10-year) flood magnitude, but the backwater effects from the Chattahoochee River pushed water levels over the 0.2 percent chance (500-year) flood at the gage location.
Ø On the Chattahoochee, USGS measured a 1 percent chance exceedence (100-year) flood at Vinings and Roswell.

“Today, six USGS crews are installing and repairing the 20 gages that were destroyed because of flooding. We expect that all but one gage should be operational by the end of the day,” said McCallum. “During flooding, these gages provide critical information to many users, so fixing the gages is our priority now.”

USGS also has two crews measuring high water marks, and will continue taking these indirect measurements in earnest on Monday. Pictures taken over the past few days by USGS scientists as they work in flooded areas are available online.

In Georgia the USGS maintains a network of more than 300 stream gages that provide data in real time. Data from these gages are used by local, state and federal officials for numerous purposes, including public safety and flood forecasting by the National Weather Service.

A map of these gages and graphs of discharge for the last seven days is available online. The USGS works in cooperation with other Federal, state, and local agencies, throughout Georgia that measure water level (stage), streamflow (discharge), and rainfall.

Users can access current flood and high flow conditions across the country at the USGS WaterWatch Web site.

More information on USGS flood-related activities is available at the USGS Surface Water Information Web site.

Edward H. Martin, (770) 903-9100, e-mail: ehmartin@usgs.gov
Brian E. McCallum, (770) 903-9127, e-mail: bemccall@usgs.gov

USGS provides science for a changing world. For more information, visit www.usgs.gov.

Subscribe to USGS News Releases via our electronic mailing list or RSS feed.

**** www.usgs.gov ****
Diane Noserale
Media Relations, Eastern Region
U.S. Geological Survey
150 National Center
Reston, VA 20192
phone: 703-648-4333
fax: 703-648-4588